


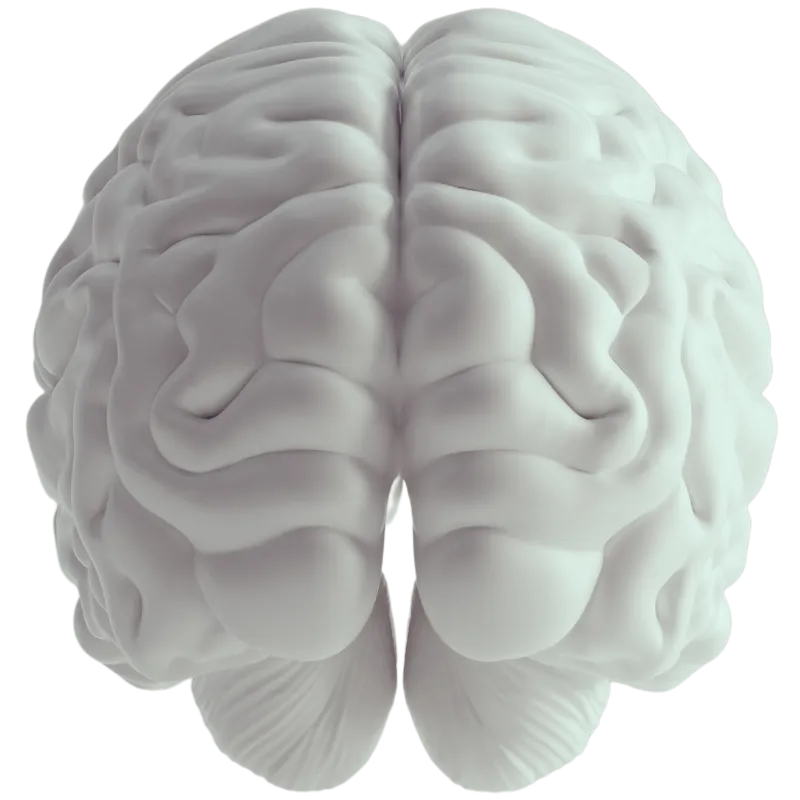
the Skill That DECIDES Everything:
Human Behavior


Hey, I’m Nicki. the AI assistant for NCI.
Ask me anything about Chase, the programs, training, or methodologies. You don’t need to know what to ask, just start where you’re curious. I’ll take it from there.
ADVANCED TRAINING CRAFTED BY #1 EXPERT, CHASE HUGHES
Your path to true mastery of confidence, behavior profiling, influence, and leadership

Master the foundational skills of nonverbal communication and human behavior trusted by leaders, therapists, and top professionals worldwide.
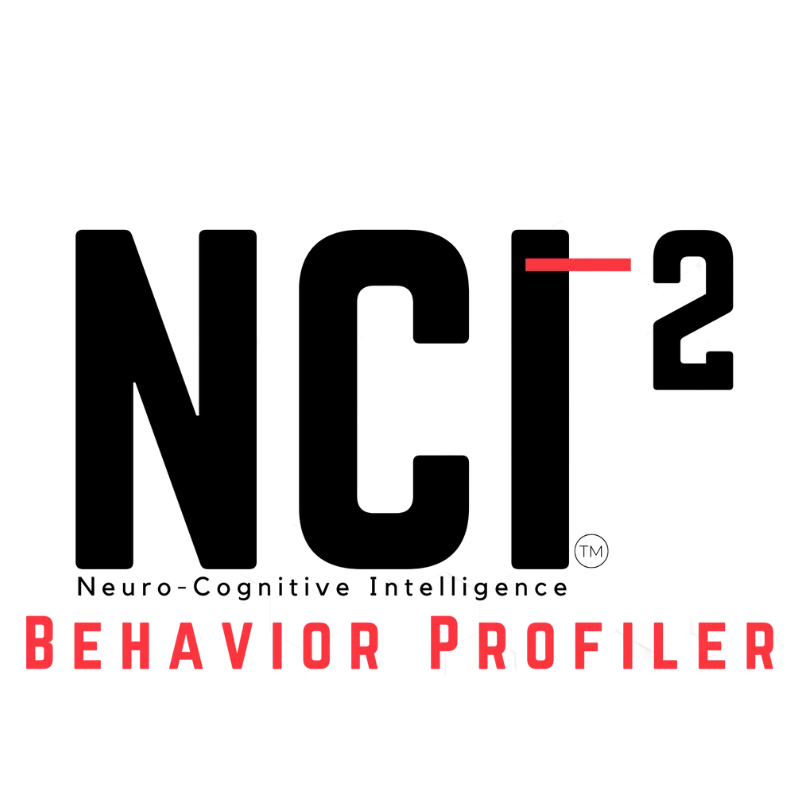
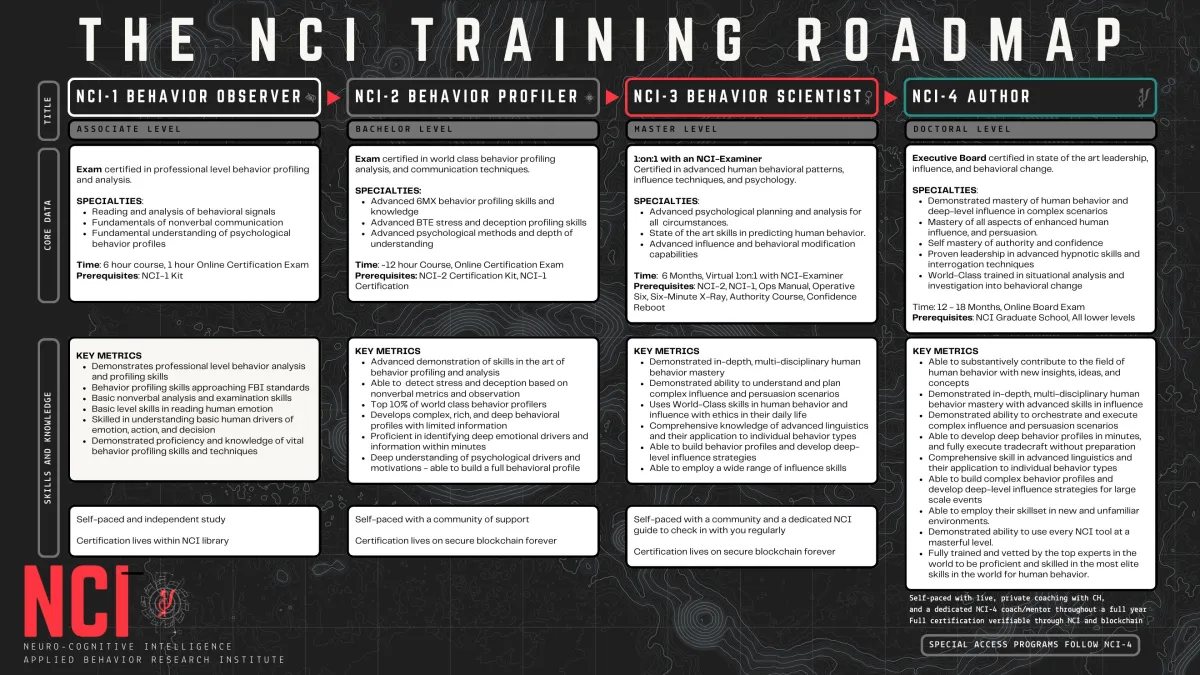
Identify & recognize human behavior with surgical precision. Build upon the NCI-1 observation skills you've learned to analyze behavior, uncover hidden truths, and guide interactions with unmatched confidence and clarity.
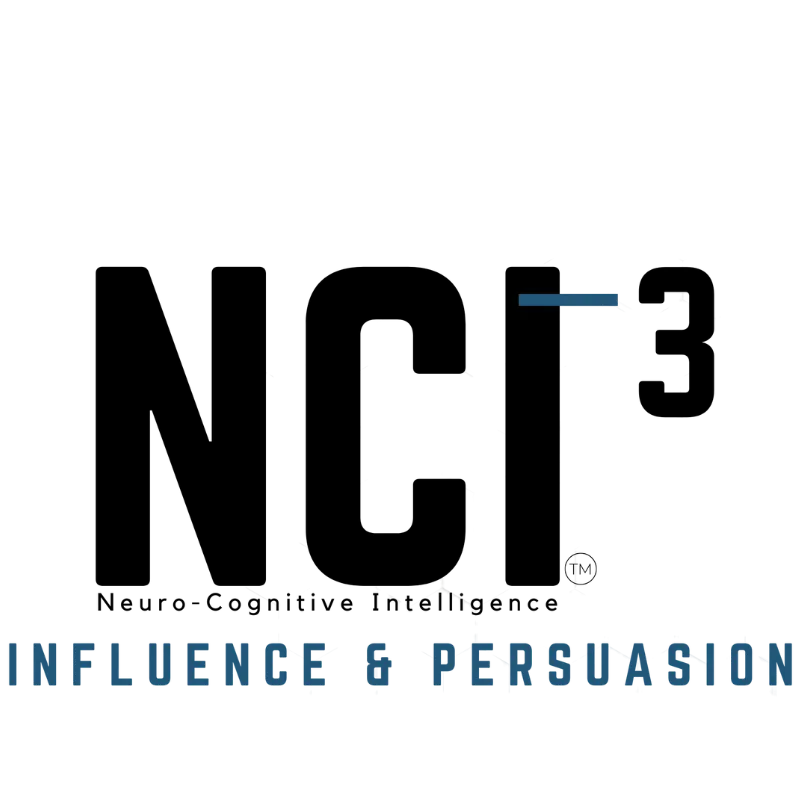
Command authority, guide decisions, and win any interaction. Go beyond theory—master the actionable skills to command respect, lead with confidence, and influence anyone, anywhere.
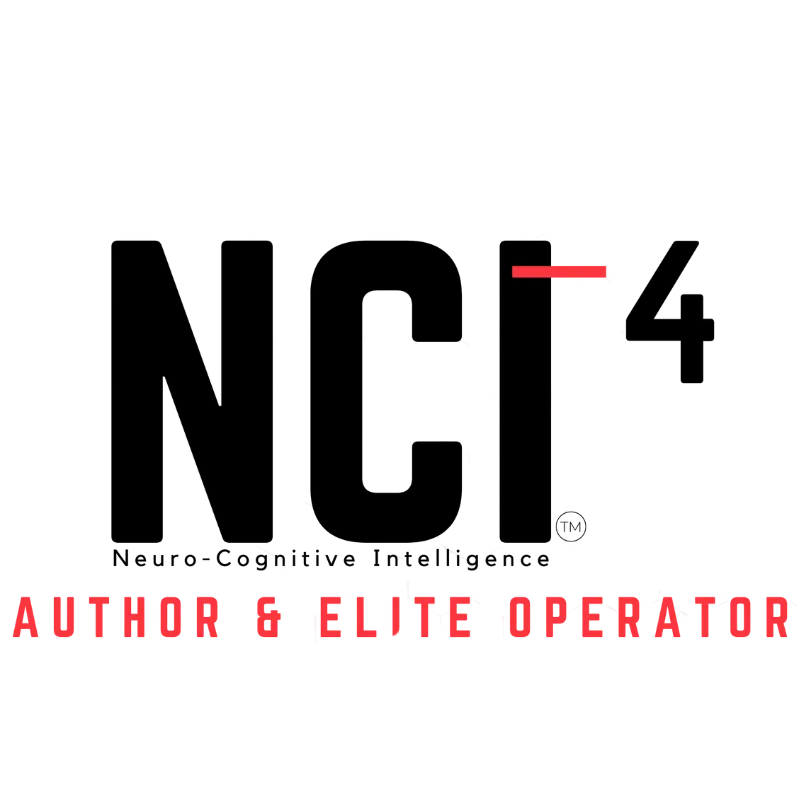
Reshape entire systems and lead with unparalleled authority. Transform into an NCI Author in just 12 months achieve the coveted NCI author certification and unlock your true potential.
THE WORD ON CHASE HUGHES + NCI UNIVERSITY
"This program is the best investment you can make in yourself."
I'm incredibly impressed with NCI University. It’s a fantastic program for anyone who wants to get better at navigating complex conversations and leading with genuine, ethical influence. A truly valuable resource for driving results and serving our company's goals. Highly recommend!

This might be the best investment you’ve ever made in yourself. The NCI content is valuable- deep and broad. No fluff. A lot of detailed information available for those who want to learn, presented in an accessible manner. The culture of the organization and the community is positive and healthy. Student study groups and the official practice calls are all good to participate in. Chase Hughes mantra that “we rise by lifting others” is expressed through every aspect of NCI. He gives a lot of value. The support team is great too - friendly, fast to respond and accurate. I highly recommend joining NCI to anyone wanting to better understand human behavior and to use that understanding to make positive contributions to others.

Transformational, Insightful, and Deeply Personal NCI-1 by Chase Hughes I’ve taken many courses over the years, but NCI-1 stands in a league of its own. Chase Hughes doesn’t just teach,he transmits. His ability to break down complex concepts with clarity and emotional intelligence is extraordinary. Every module felt like a revelation, and the depth of insight packed into this course has taken me months to fully integrate and I’m still revisiting it.

I am learning a lot from the online material and books and weekly videos with Chase and his team. I will continue my training to become a master.

Simply and most of all, the sense of finally being at the right place. Authentic, eye opening, short, clear vision of the world exactly the way it really is, unpacked, perfectly matching to my own, inner, subconscious sense of truth about it. Chase Hughes makes this experience full of hope that there is still common sense and goodness in this world. I am greatfull you exist.

NCI is the tractor beam that pulled me back in to myself. I realized I'd been living with a lot of doubt inside my body, which isn't usual for me. Something I've always had is trust in myself and my own signals. Joining NCI has placed my trust back where it belongs, in my center, in my body. This has given me the ability to separate outside noise before it becomes inner chaos- and turns into entropy.

As a therapist, Friday Night Love at NCI has been an incredible addition to my continuing education as I work with others, and as I continue to grow in character and skill to assist others in their healing journeys. Learning to be skilled in ways that facilitate a true breakthrough for others is what I’m after. I’m glad I found NCI to help me continue moving in that direction.

I love the revamp of the program. What I enjoy most of it is how relatable the subject matter is not only to understanding how other people operate but more importantly how I operate. I can see myself in so much of what characteristics and traits that Chase talks about. In the NCI Graduate School lesson on Needs, Decisions, Values Error Correction I found myself identifying with one of the descriptions of needs, decisions and values. I am so looking forward to finishing this course and earning my certification that I have purchased NCI-2. I can see how NCI is not only beneficial in a business environment, but probably more important in a personal environment. I love how honest and real Chase is in his training sessions.

I am super happy studying with you! Chase is such an amazing teacher! Everything you guys do resonate with me and I learn so much! Thank you Just Grea

I learned of Chase via The Behaviour Panel on YouTube. I now listen in regularly to Chase's Friday Night Live sessions and glean thought-provoking new perspectives. I love deep thinkers, and Chase is obviously well-read, experienced and has spent a lot of time considering and practicing the insights he shares.

Very informative, eye opening to a lot about life and people behaviors

It has been an honor to be a student at NCI. Chase Hughes has had a career that is elite in every sense of the word. I’m thankful that he is sharing his knowledge with regular people because he doesn’t have to. His team is just as good, they are doing amazing things out here.

FREE MASTERCLASS REVEALS THE POWER OF NCI:
Unlock the 6 Hidden Triggers Behind Every Decision—And Transform How You Influence Others
Use the same secret frameworks trusted by Fortune 500 leaders and elite operatives to profile, influence & lead.
A Pathway to Mastery
The Neuro-Cognitive Intelligence (NCI) program is the gold standard in human behavior mastery, blending neuroscience, psychology, and behavioral science for real-world application. Whether you're negotiating, leading, or decoding motives, NCI gives you the tools to influence and transform interactions like nothing else.
Direct, Actionable Skills for Every Situation
Actionable skills that can be applied immediately, in everyday life and high-pressure environments. At every level of the certification process, from NCI-1 to 4, you are equipped to read and decode human behavior, predict future actions, and influence outcomes

Cutting Edge Skills
NCI graduates remain at the forefront of human behavior research, adapting to new discoveries and advancements in the field. NCI’s evolving curriculum keeps you ahead of the curve, ensuring your knowledge remains sharp and applicable to the most modern challenges.
Real-World Expertise, Not Classroom Theory
Prepares you for real-world challenges where understanding and influencing human behavior can make or break your success. The hands-on nature of NCI means you’re not learning from a textbook, but from the most cutting-edge advancements in neuroscience and behavioral research.

Tailored for You
Whether you’re an entrepreneur, an executive, a negotiator, or someone in a position to influence others, the NCI program gives you the tools to guide, influence, and lead in a way that no standard academic program can. It transforms individuals into experts who understand not only how people behave but why—and how to leverage that knowledge for success.

WHO IS CHASE HUGHES?
"Success will come down to a person's understanding of human behavior. EVERY TIME."
Chase Hughes retired from the US military in 2019. After a 20-year career, Chase now teaches interrogation, sales, influence, and persuasion.
He developed the NCI system for intelligence agencies, which is now the gold standard in Tradecraft.
Chase is the author of the #1 Bestselling book on behavior profiling, persuasion, and influence, The Ops Manual
EXPOSING WHAT ONLY THE 1% KNOW...
The Diary Of A CEO Podcast
The Danny Jones Podcast
PBD Podcast
The Morgan Nelson Podcast
The DRVN Podcast
The Joe Rogan Experience
Meet Your NCI University Team

Merlin O'Brecht
Dean of Academic Affairs

Camron Sayyah
Success Coach

Reba Salmon
Senior Enrollment Coach

Mackie
Success Coach

Michael Cullen
Success Coach

Darius Vega
Live Events and Marketing Strategist

Eric Auger
Sales, Marketing & Tech

Sadie Rogers
Social Media Strategist

Eli Sanchez
Director of Sales

Holly Fish
CEO

Chris Prynne
E3 Manager

Jill Lange
Customer Support

Julias Shaw
Director of Asterisk
Join CHASE every Friday night AT 6 PM EST LIVE ON ZOOM FOR "FRIDAY NIGHT LIVE"
Dive deep into human behavior, influence, and psychology—unfiltered and in real-time. This coming Friday Chase talks about:
...
Join CHASE every Friday night for Friday Night Live...
Dive deep into human behavior, influence, and psychology—unfiltered and in real-time.
If you’re ready to sharpen your skills, challenge the way you think, and gain powerful insights you won’t find anywhere else, sign up now and be part of the conversation!

As seen on the "Joe Rogan Experience Podcast"
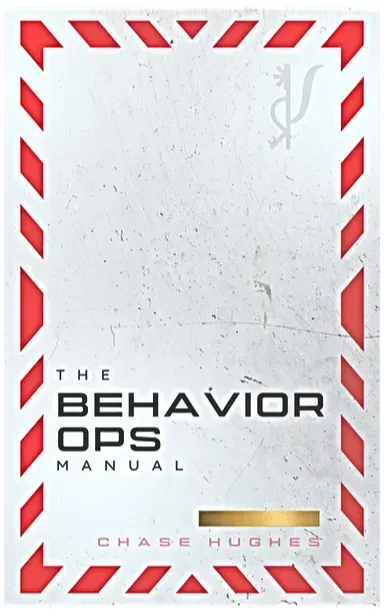
THE BEHAVIOR OPERATIONS MANUAL
Every script and technique are laid out so that you can literally execute profound influence within minutes....
Saw the Behavior Ops Manual on Joe Rogan?
NCI COURSES
GRAD SCHOOL (NCI-4)
LIVE EVENTS
LEGAL
CONTACT
+1 757-895-7358
© Copyright 2026. NCI University. All Rights Reserved.